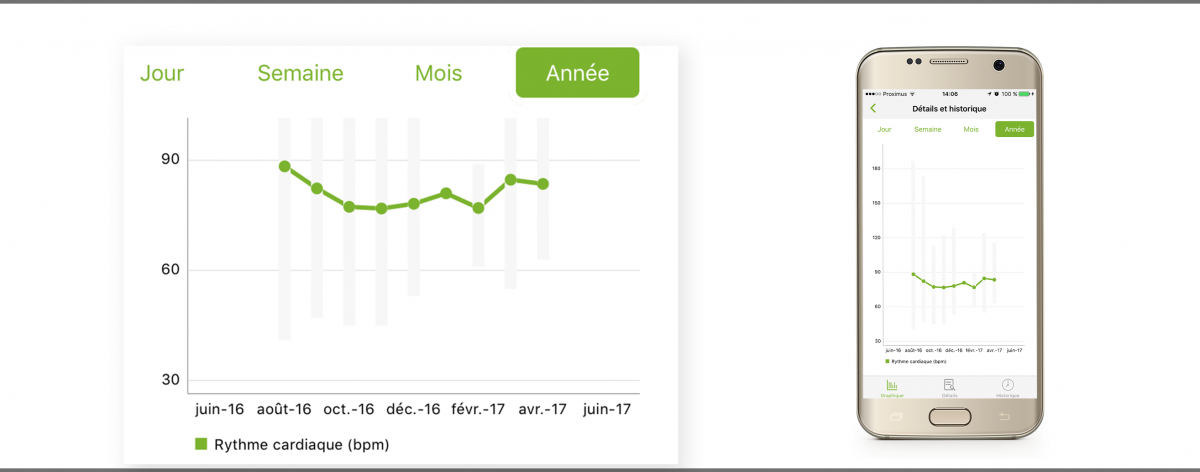
Make room for the brand new graphs!

Having all medical data at one place is great, no doubt about that.
Being able to visualize them in an easy way is even better! Right ? Well...here come our brand new graphs!
This feature has been completely reviewed for the release of our Version 2.0. It now allows users to display any tracking of numeric values as graphs...so much more efficient!
Take the sugar level of diabetic patients for example. Instead of displaying their data as lines of numbers, they can benefit from a user friendly graph and easily detect any peak or drop in their tracking. We believe this is a truly great feature and we"re sure you're going to love it as well !
Recommended articles : Version 2.0: Everything you need to know! & Graphs have a new look! & New feature - Charts


