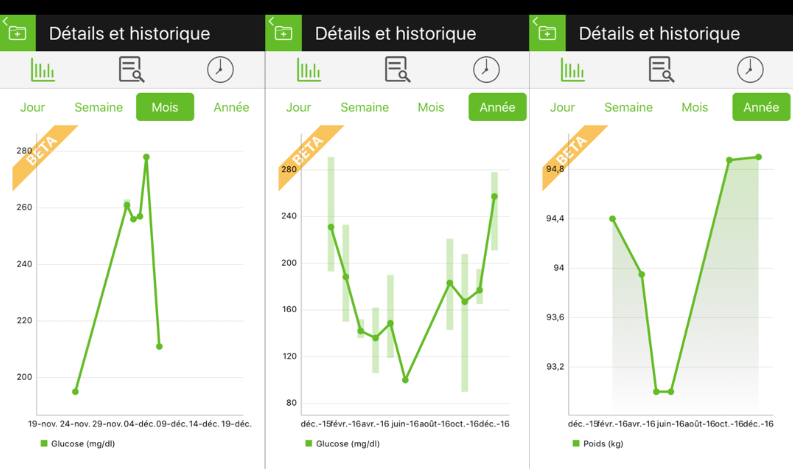
A little Christmas gift for our users. From now on, you’ll be able to visualize your medical data in the form of a chart! Ideal for a quick overview of large amounts of data.
It is now possible to display a series of numerical data in a chart. Weight, for instance, can be calculated by a connected mobile device (smart scale) and then displayed in a chart to illustrate changes over time.

In order to display the numerical data, one must select the data in question and tap the “chart/graph” icon located by the “information” and “history” icons.

In the upcoming months, our efforts to continuously improve the application will bear some fruits. Without giving too much away, we’re currently working on a feature that will help users manage their medicines as well as monitor their drug intake. More info comming soon.
Recommended articles : New feature Version 2.0 - Improved graphs & Graphs have a new look! & V2 coming soon!


