Written by Lucie Keunen
Product Owner Andaman7
Android 2.4 - iOS 2.4
Description
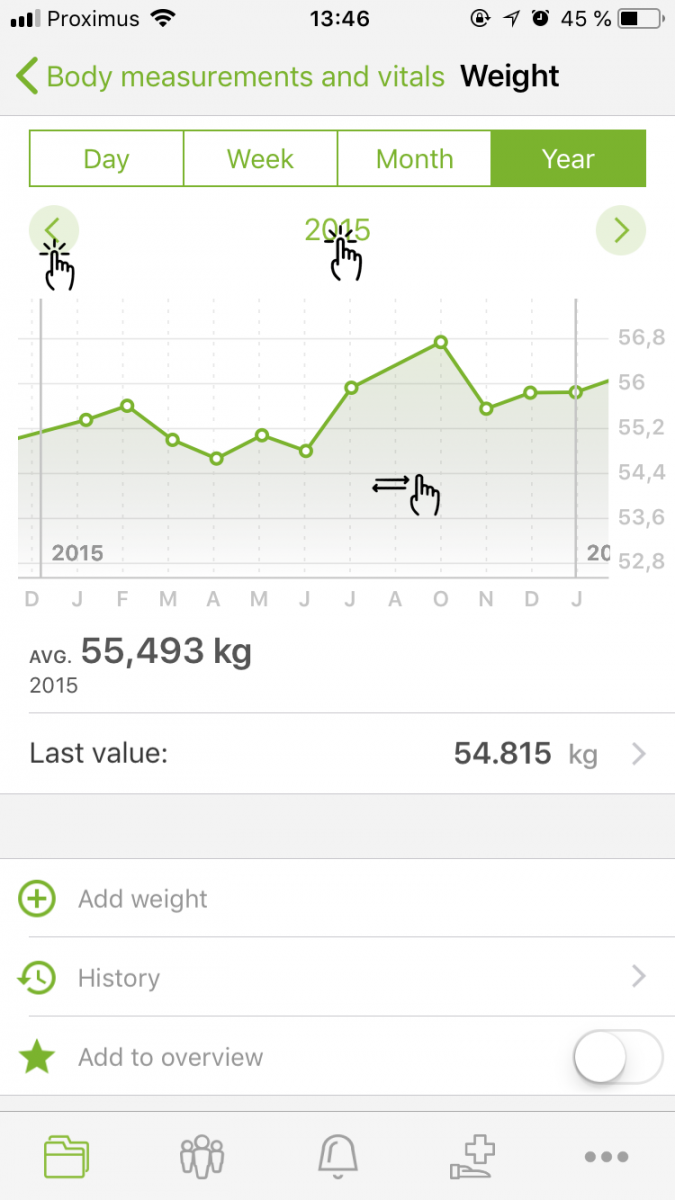
Now you can easily navigate your health data in charts. You can view your health data of the current day, week, month and year, but also data of the previous periods of time.
Why is it important?
Charts are very useful when it comes to observing health data over time. Sometimes the changes in your health data are very slow, and the trends can only be shown by looking at data points spread over several years. It is therefore important to have the ability to see the data charts and view all the data. Andaman7 makes this very easy for you or anyone caring for you.
How does it work?
First choose the data you want to view like weight, heart rate, or cholesterol levels. Then choose the time window you want to view, by selecting "Day", "Week", "Month" or "Year". There are then 3 ways to navigate through the charts:
- By scrolling the graph from left to right,
- By clicking on the arrows on either sides of the date,
- By clicking on the date range above the chart; then choosing the date you want to go to.
Where can we see it?
Find this feature on all charts! They are available in the following sections:
- Measurements and vital signs
- Blood, urine, other tests
- Nutrition
- Physical activity and sleep
- Reproductive health


